Editor's Picks

Images and insights from Ezra Barnea’s journey to Cyprus’s...
Ezra Barnea
|
Jun 13, 2026

Endangered oak Quercus hinckleyi shows strong genetic...
Website Editor
|
Jun 09, 2026

New paper should significantly change our approach to...
Steve Potter
|
Jun 09, 2026
Plant Focus

Roderick Cameron and Carlos Vila-Viçosa give an account of this intriguing species from northwestern Iberia with a complex taxonomic and...
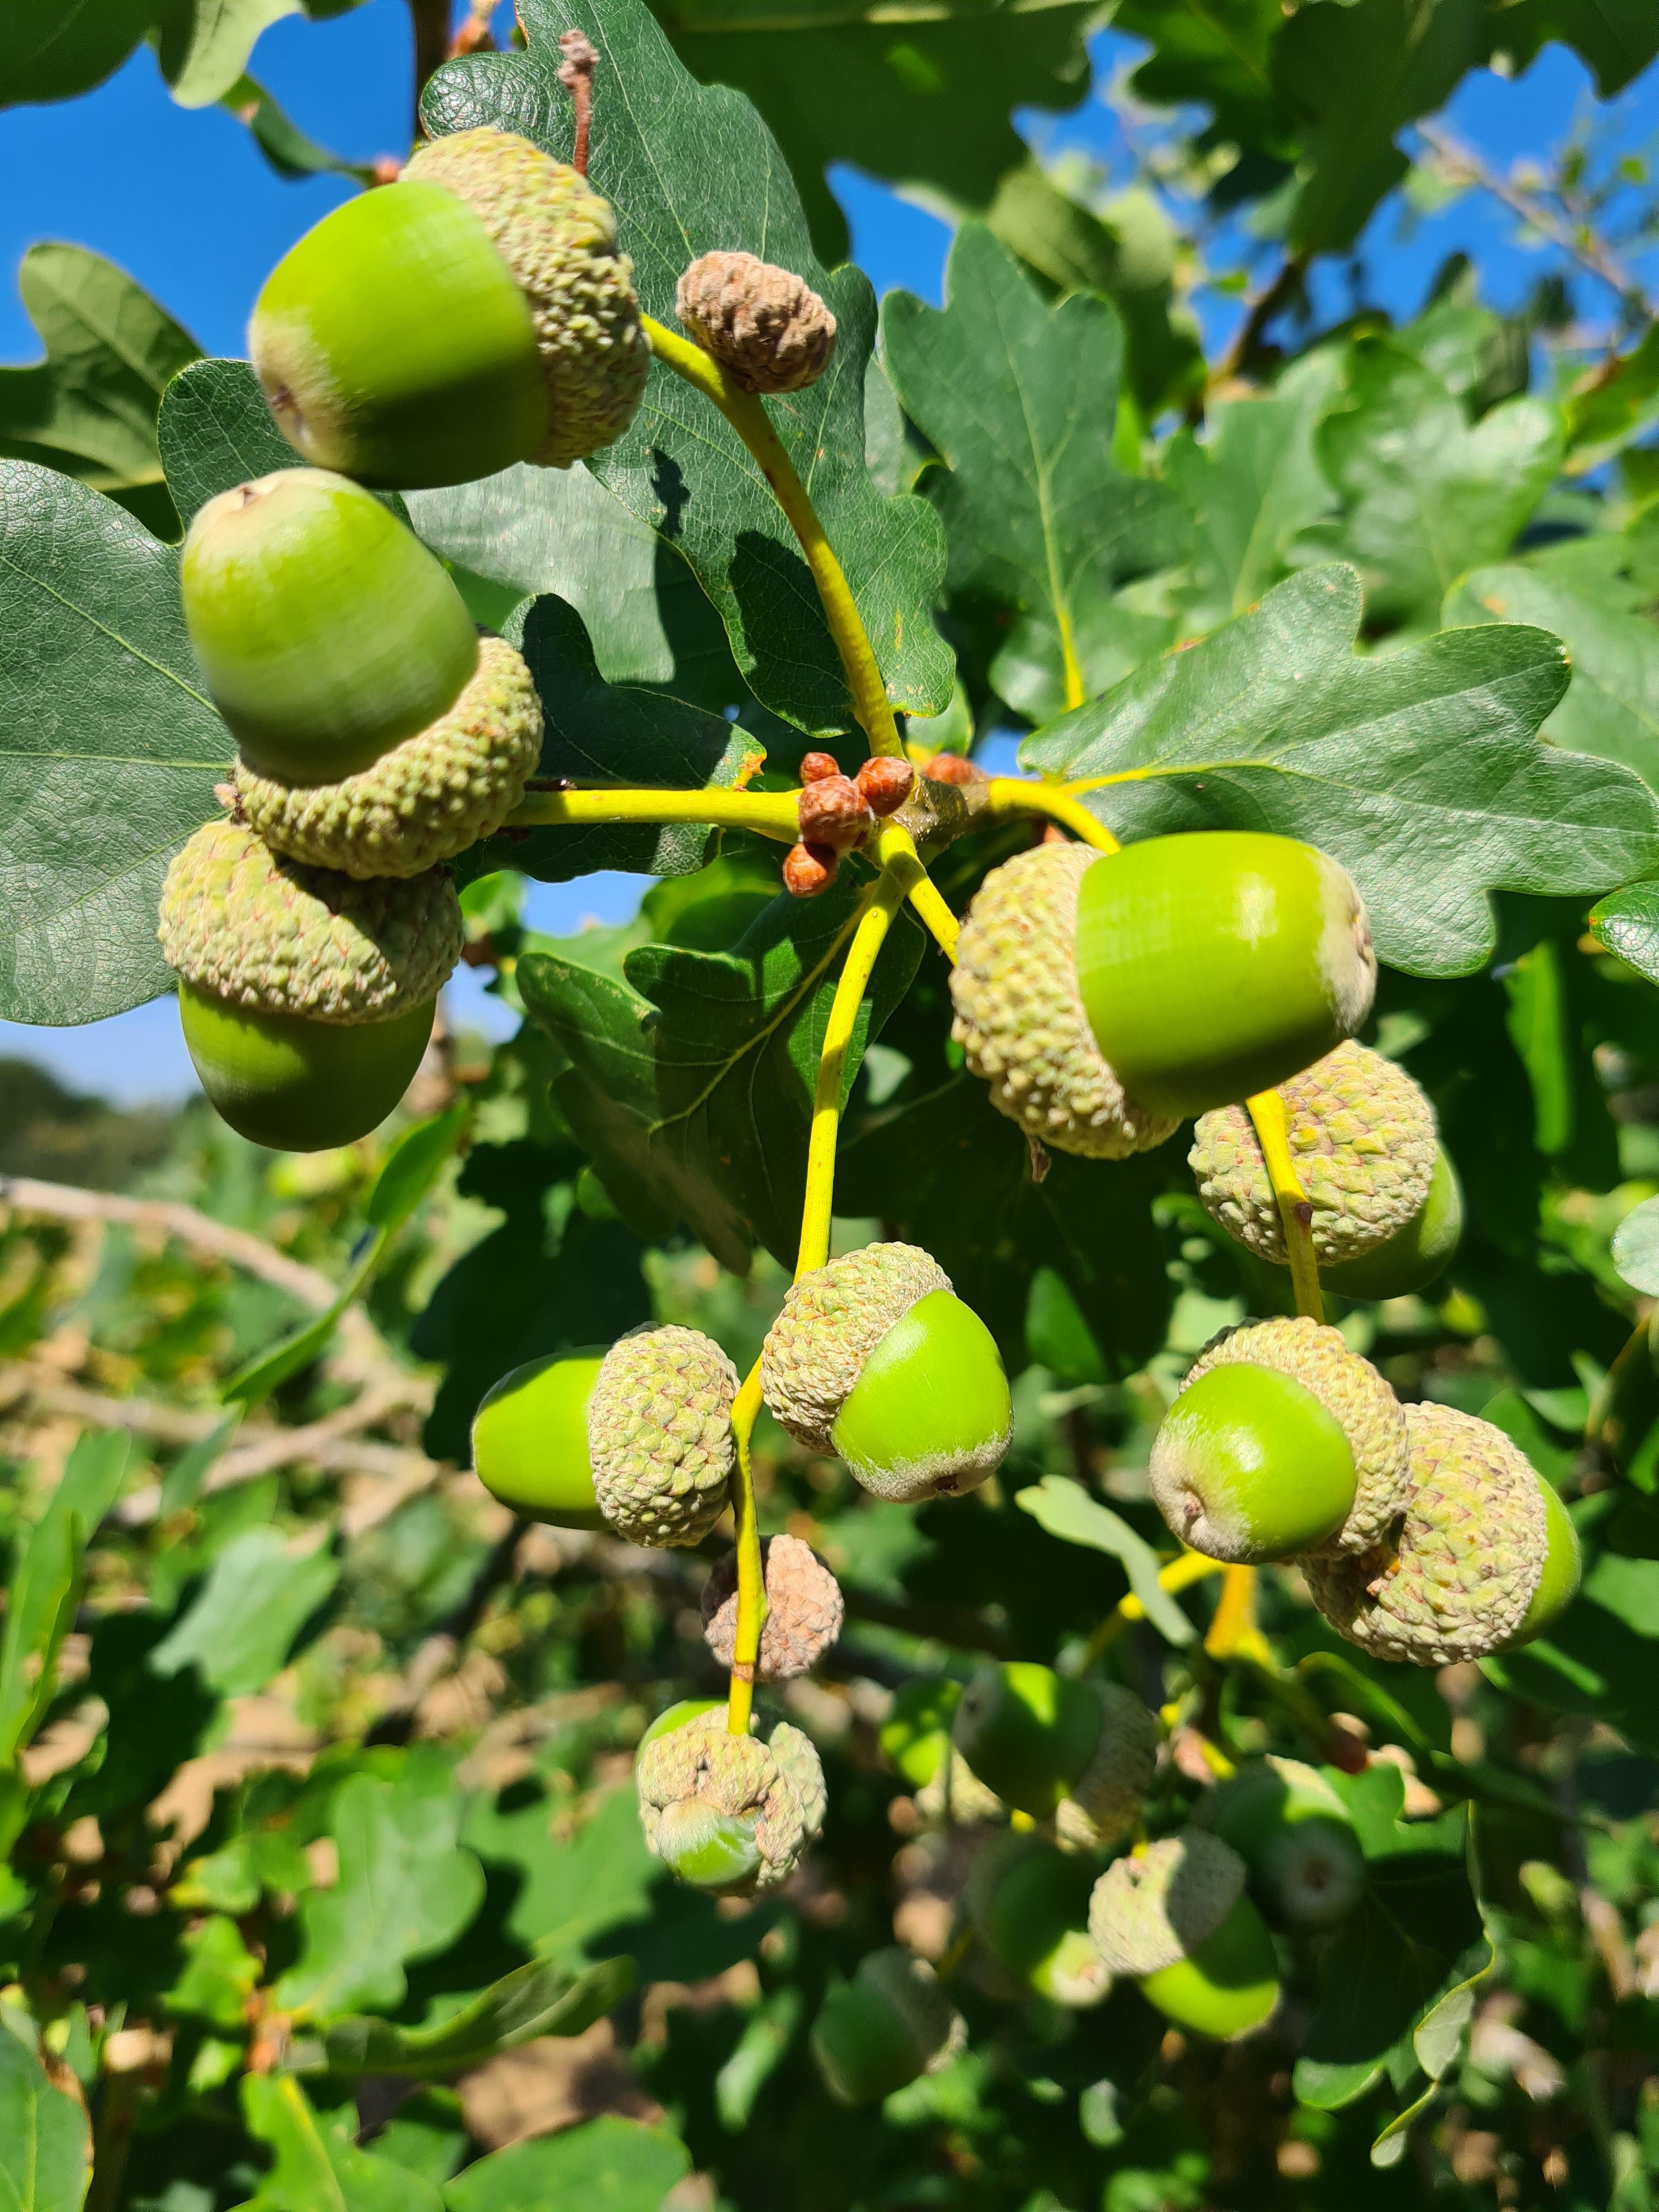
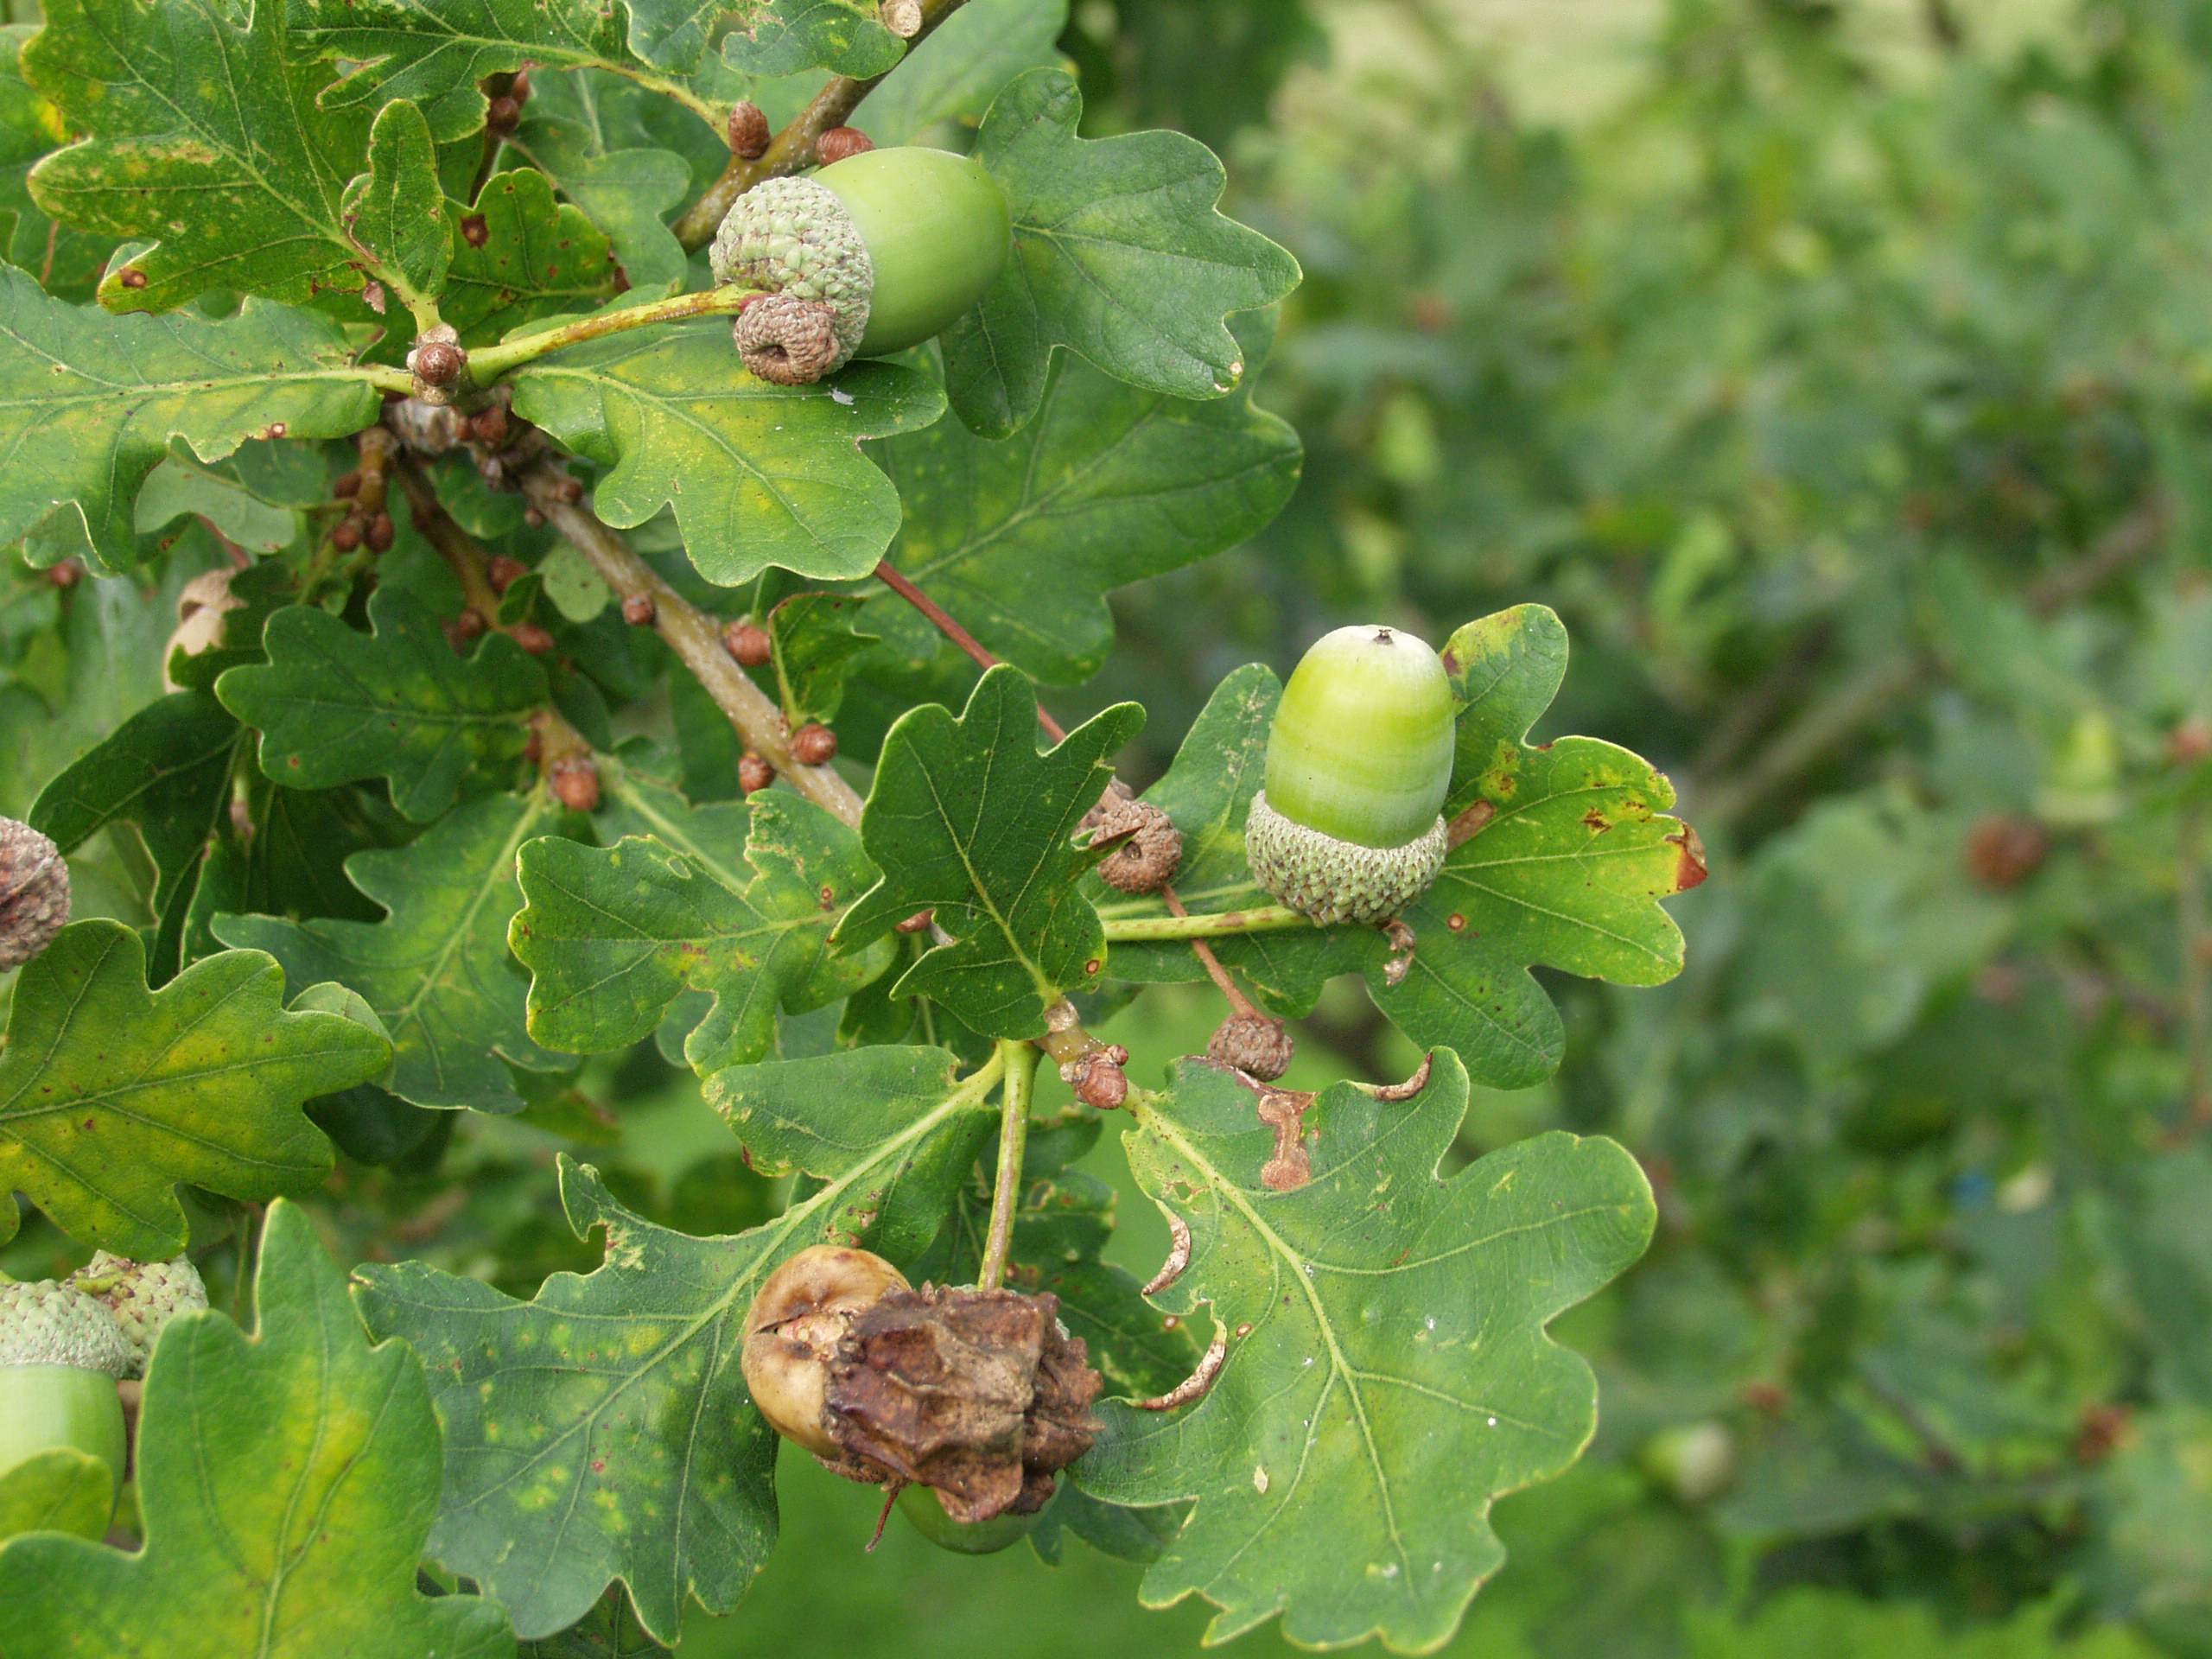
I am carrying out a long-term study of the ecology of Quercus robur, including insect herbivore impacts on girth increment. Part of the study includes an annual acorn count, and I am looking for collaborators who may be able to assist by providing data on acorn production in other locations in order to demonstrate the generality (or not) of the patterns exhibited by the Silwood data.

The time series (above) shows mean acorn numbers per shoot of Quercus robur in Silwood Park from 1979 to 2024. I’m interested to discover whether there is synchrony in large acorn crops, and if so, at what spatial scales that synchrony operates (within Great Britain and within Europe more widely).
Please let me know (click here to email me) if you are aware of similar data sets so that we can cooperate in preparing a multi-author paper for a high-impact scientific journal like Science or Nature.
Method: In 1979, a cohort of 30 individuals of Q. robur were selected at random within three size classes: 10 small plants (girth at breast height (gbh) < 100cm), 10 medium (gbh 100 < > 200 cm) and 10 large trees (gbh > 200 cm) from 50 previously selected suitable trees in each size class. In late August each year, before any natural acorn drop had occurred, the acorn crop of each individual was assessed as follows, based on 100 shoots from each tree in each year. The only correct way to select shoots from an oak canopy at random would be to mark and number every shoot, then use a random number generator to select 100 shoots. This, of course, is impossibly impractical. In practice, the idea is simply to be as unbiased as possible. I walk around the canopy with binoculars and scan across 10 shoots and record the number of acorns on each one ( e.g., 0,0,2,0,3,0,0,5,0,1). Note that for this part of the exercise, Knopper galls of Andricus quercuscalicis are counted as if they were acorns, and the quantitative distribution of galls across acorn cups is assessed separately, later that same day. Then I walk one tenth of the way around the base of the canopy, alternate my binocular view either up or down, then repeat the count across another 10 shoots. And so on till I have walked the entire circumference of the canopy and recorded 100 shoots. The summary statistic used in the time series (above) is the mean number of acorn cups per shoot (containing either a mature acorn or one or more Knopper galls).
M.J. Crawley, Imperial College London, Silwood Park, Ascot, UK, SL5 7PY
The International Oak Society acknowledges the generous support of the following institutions:
Supporting Institutional Members


Standard Institutional Members

